Articles
Thoughts and observations on a whole range of Sustainability topics
ESG, Decarbonisation, Social Impact, Electric Vehicles, Decarbonisation of buildings, Just Transition and lots more
EVs – Range per Grand
You get what you pay for – or do you?
I’m sure most of us assume that if we spend a bit more on something we get a better quality.
That’s certainly what many companies promote. The “Good, Better, Best” school of marketing. It is most obvious in everyday life if you go to the supermarket and look at own brand goods.
If you shop at Tesco, you’ll know Tesco Value has been replaced by ‘Exclusively at Tesco’, then you have normal Tesco own brand then ‘Tesco finest’.
If it’s Sainsbury’s you’ll see ‘basics’ then ‘by Sainsbury’s’ and then ‘Taste the Difference’.
Or maybe you go to discounters for some items and then Waitrose or M&S for certain ‘premium’ products.
So it wouldn’t be surprising if one assumed the same to be true with Electric Vehicles.
If you spend more you’d expect to get a vehicle which if more efficient and takes you further for your money. All that extra cost must go into high quality parts, better design, industry leading aerodynamics, reduced rolling resistance and so on… surely?
Well No. It appears not.
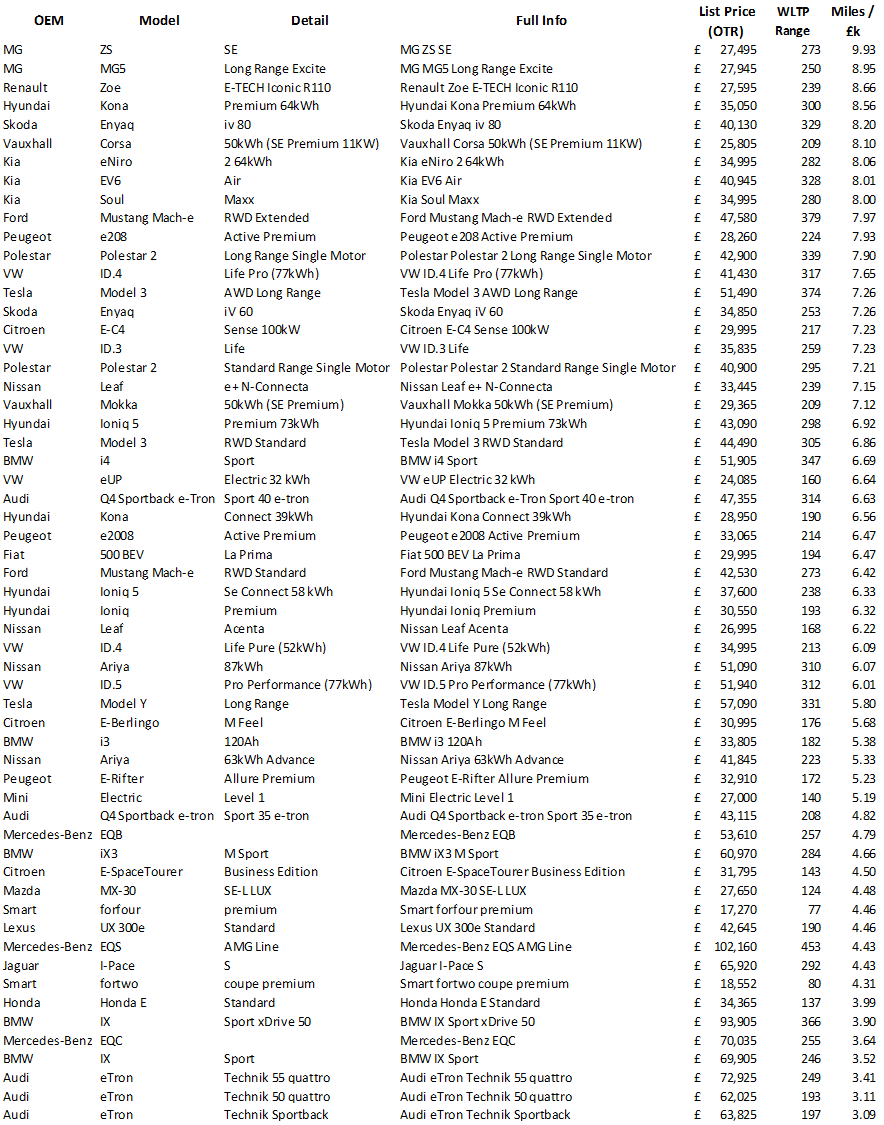
In fact having just analysed all the main EVs currently available on the UK market it appears that generally the more you spend the less miles per grand (i.e. miles per thousand pounds of purchase price) you actually get!


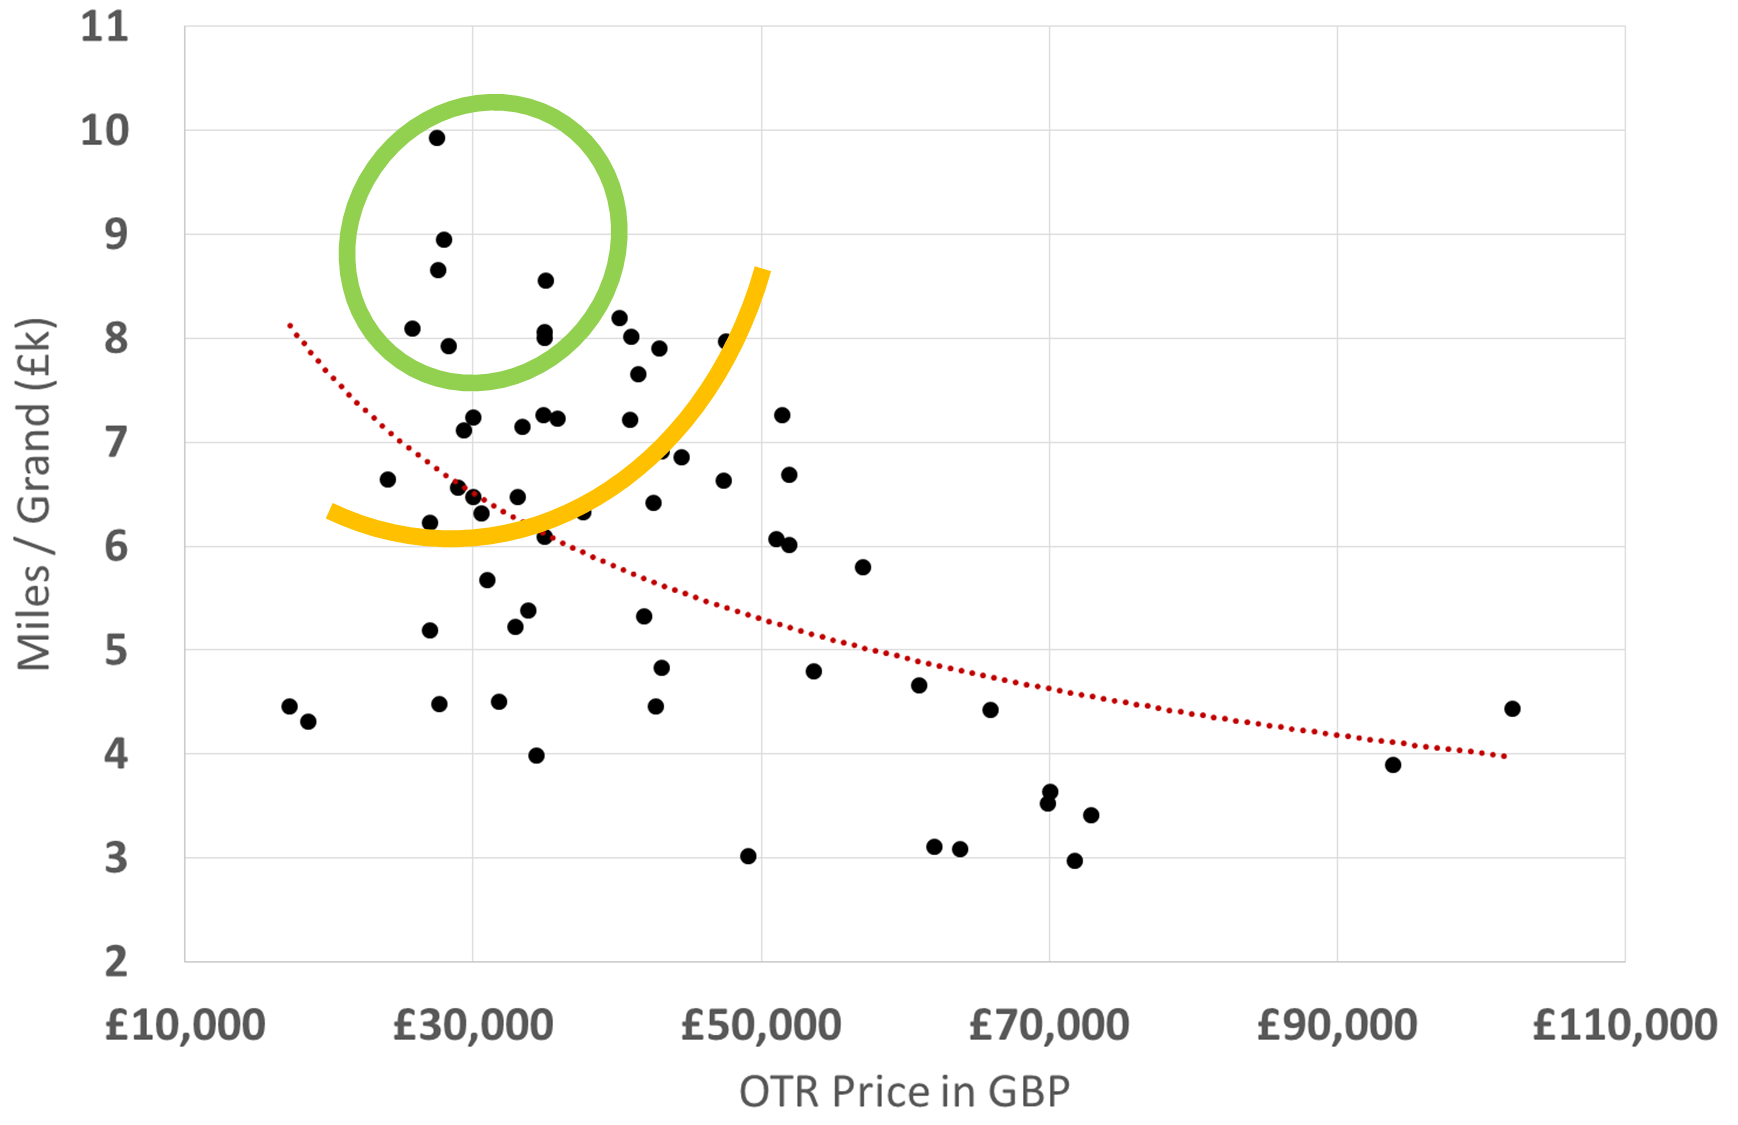
As you’d expect it’s not perfectly correlated.
(All the dots being on the trendline – whether a straight, exponential, power trend – would show that).
But I hope you’ll agree the trend certainly suggests the MORE you spend the LESS Miles/Grand you get.
The highest Miles/Grand (and so arguably best value EV on the market) achieves 9.93 miles per grand you spend.
The lowest 3.09.
But maybe the car with 3.09 costs a lot but has a massive range you ask? (I excluded people carriers to make it fair and like for like)
Well no again.
The range of the lowest scoring car on this metric is 197 miles and the top performer is 273 miles.
In fact the top 5 performers on Mile/Grand average 278 miles whereas the bottom 5 average 228.
All the ranges are WLTP and all the prices are the entry level spec for that battery size using the Manufacturer quoted OTR (On-the-road) price. And only one car that costs more than £50k scores above 7 (and that gets 7.26)
So what’s different? Well as is often the case in “Good, Better, Best” the brand.
Now it may well be that the quality of the lower performers on this metrics is so much better in your eyes that you’re prepared to pay lots of extra money (albeit the great research by Adrian Porter and his Which team might suggest otherwise when it comes to reliability at least but you can read that on LinkedIn or click on the picture on the right and make your own mind up), or the badge is all important to you.
But personally I wouldn’t want to spend three times as much on a Miles/Grand basis for the logo on the car.
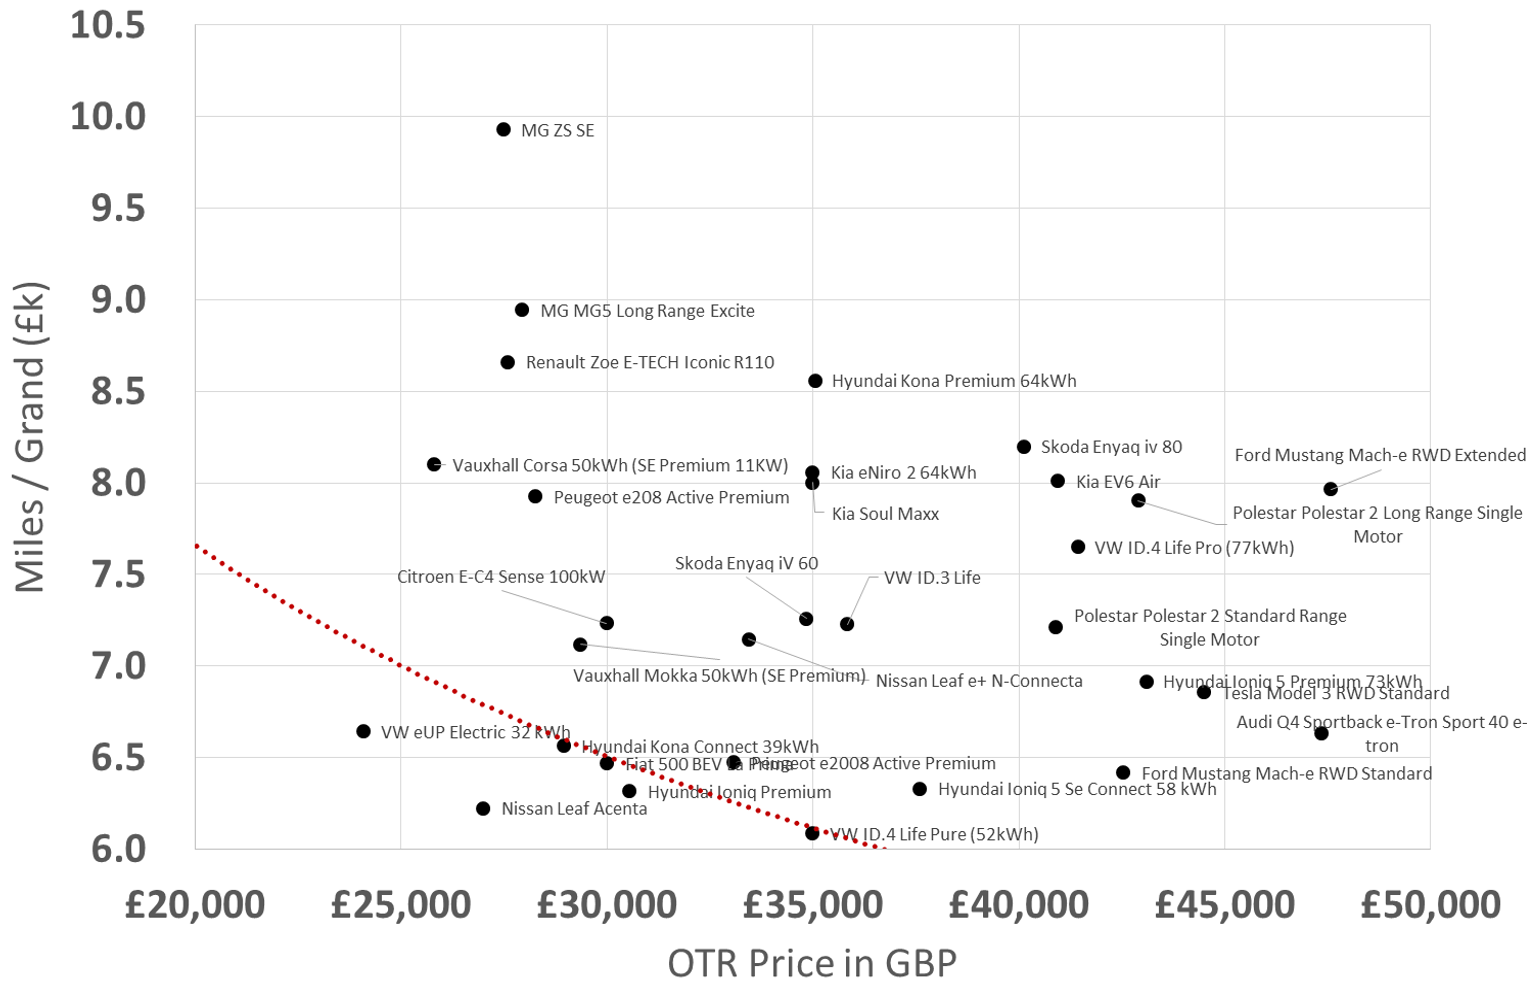
I'm sure by now you want to know detail of which cars sit where, so below is a zoom in with labels of the relevant part of the graph, then right at the bottom of the post is the table of all the cars analysed.
If you've found this useful please subscribe to future articles or if I can help with anything you are working on in the ESG, Sustainability, Electric Vehicles space contact me via one of the links on the site or email me direct at simon@participation.co.uk
Keep KISSING Sustainability. Simon xx
Sustainability Articles